iskaggle = os.environ.get('KAGGLE_KERNEL_RUN_TYPE', '')
if iskaggle: path = Path('../input/titanic')
else:
    path = Path('titanic')
    if not path.exists():
        import zipfile,kaggle
        kaggle.api.competition_download_cli(str(path))
zipfile.ZipFile(f'{path}.zip').extractall(path)Setup using a paperspace gradient notebook
import torch, numpy as np, pandas as pd
np.set_printoptions(linewidth=140)
torch.set_printoptions(linewidth=140, sci_mode=False, edgeitems=7)
pd.set_option('display.width', 140)
df = pd.read_csv(path/'train.csv')
tst_df = pd.read_csv(path/'test.csv')
modes = df.mode().iloc[0]def proc_data(df):
df['Fare'] = df.Fare.fillna(0)
df.fillna(modes, inplace=True)
df['LogFare'] = np.log1p(df['Fare'])
df['Embarked'] = pd.Categorical(df.Embarked)
df['Sex'] = pd.Categorical(df.Sex)
proc_data(df)
proc_data(tst_df)cats=["Sex","Embarked"]
conts=['Age', 'SibSp', 'Parch', 'LogFare',"Pclass"]
dep="Survived"
from numpy import random
from sklearn.model_selection import train_test_split

# set random seed to reproduce results
random.seed(42)
trn_df,val_df = train_test_split(df, test_size=0.25)
trn_df[cats] = trn_df[cats].apply(lambda x: x.cat.codes)
val_df[cats] = val_df[cats].apply(lambda x: x.cat.codes)
ModuleNotFoundError: No module named 'numpy'def xs_y(df):
xs = df[cats+conts].copy()
return xs,df[dep] if dep in df else None
trn_xs,trn_y = xs_y(trn_df)
val_xs,val_y = xs_y(val_df)from sklearn.metrics import mean_absolute_errorfrom sklearn.tree import DecisionTreeClassifier, export_graphviz
m = DecisionTreeClassifier(max_leaf_nodes=4).fit(trn_xs, trn_y);from sklearn.ensemble import RandomForestClassifier
rf = RandomForestClassifier(100, min_samples_leaf=5)
rf.fit(trn_xs, trn_y);
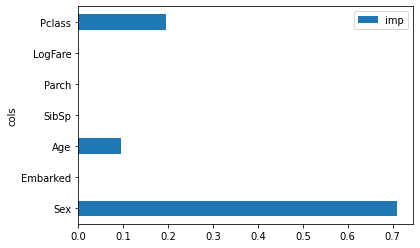
mean_absolute_error(val_y, rf.predict(val_xs))0.18834080717488788m.feature_importances_array([0.71053851, 0. , 0.09383065, 0. , 0. , 0. , 0.19563083])pd.DataFrame(dict(cols=trn_xs.columns, imp=m.feature_importances_)).plot('cols', 'imp', 'barh');